6.2. MPTGS GUI
The MPTGS provides a GUI to control the system. The GUI can run on Linux or Windows systems, and multiple instances of the GUI can be running from different locations simultaneously.
6.2.1. Controls
The GUI provides a set of buttons in the upper left that provide controls for the MPTGS.
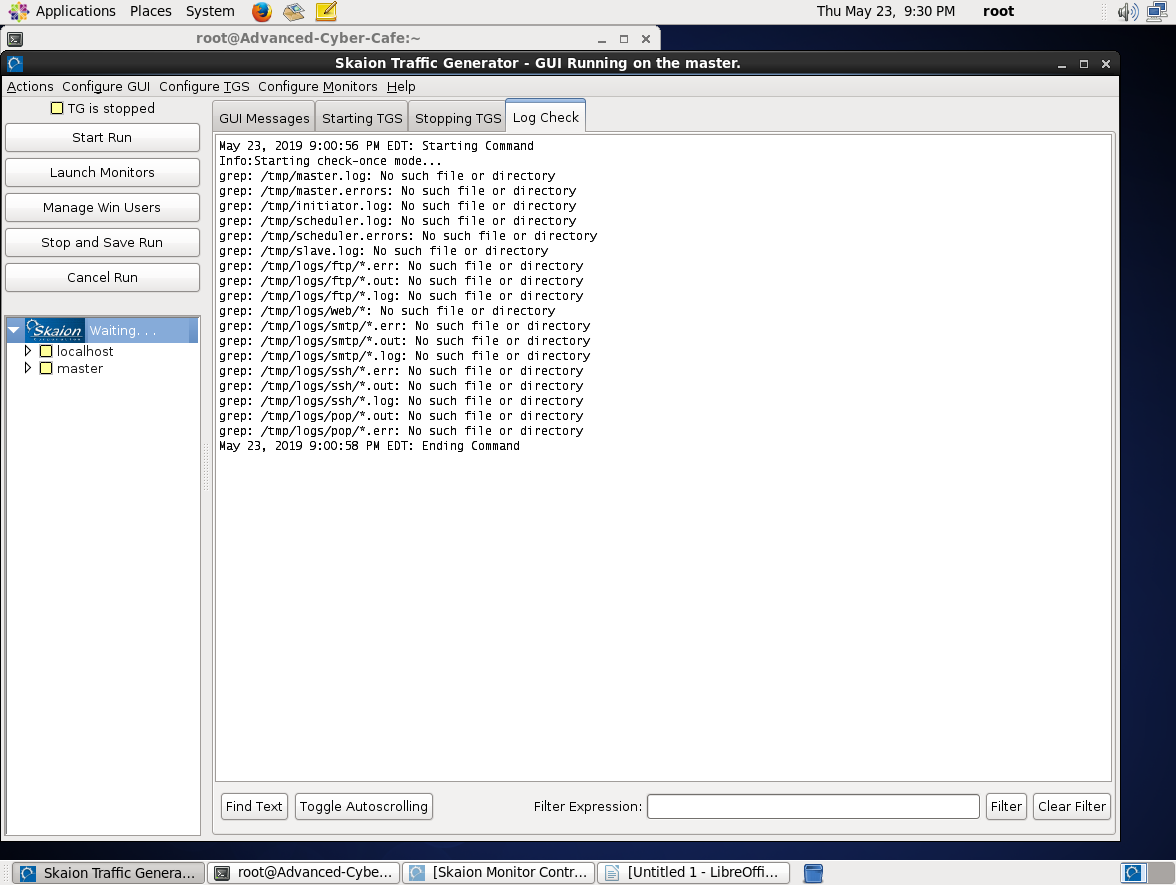
Screenshot of the GUI in a “not running” state
The “Start Run” button will, not surprisingly, start the run using the current configuration information.
“Launch Monitors” will open the mptgs_monitors which allows customizable monitoring of network traffic (whether or not the traffic is produced by the MPTGS).
“Manage Win Users” is only applicable in some installations. It will open a new window that allows you to configure and control instances of the Win User product.
“Stop and Save Run” and “Cancel Run” are generally equally valid ways to stop a run. Specific projects in the past led to the different buttons, but those distinctions do not apply any more.
6.2.2. Configuration
The GUI exposes many configuration options, which will override defaults. The current values for configuration options can be seen by selecting Configure the TGS->Display Current Configuration or by pressing CTRL+D.
6.2.2.1. Configure MPTGS
There are many configuration options that will affect how the MPTGS operates. The GUI can be configured to pass a number of them along to override defaults. A complete listing of configuration options and their meanings is available at Configuring MPTGS.
To access them use the Configure TGS menu to select the option you want to specify, or use the associated shortcut. The shortcut keys can be found either in the menu listings or in the builtin Help menu.
Option Name |
Shortcut |
Description |
|---|---|---|
|
CTRL + F |
Load previously saved configuration settings from a file. |
|
CTRL + S |
Save the current settings to a file |
|
CTRL + D |
Print the current settings in the “GUI Messages” tab |
Select Schedule File (only available on the orchestrator) |
CTRL + O (letter “Oh”) |
Select which schedule file will be used during the next run |
Edit Schedule File (only available on the orchestrator) |
CTRL + E |
Open a basic editor on the selected schedule file |
Set Random Seed |
CTRL + T |
Set the random seed that will be used to initialize various elements of the MPTGS |
Set Log Name Prefix |
CTRL + L |
Set the string that will be the prefix of each bot logfile |
Set Attack Scaling |
CTRL + A |
With the Malicous TG, the multiplier applied to the volume of each type of malicious activity “per day” |
Set Scan Scaling |
CTRL + N |
With the Malicous TG, the multiplier applied to the volume of each type of scanning activity “per day” |
Set Experiment ID |
CTRL + P |
The identifier for this run of the MPTGS. This is combined with the log prefix and can be used to track which run produced a given log file |
Set Start Time |
CTRL + M |
NOT USED - TO BE REMOVED |
Set Run Duration |
CTRL + U |
How much time after starting the run should the GUI automatically stop it |
6.2.2.2. Configure GUI
In addition, there are configuration options that will affect how the GUI itself operates, as opposed to influencing how the MPTGS works.
Option Name |
Shortcut |
Description |
|---|---|---|
Active Tab |
When the GUI has multiple tabs of text, this menu provides a way to switch to a particular tab. |
|
|
The assorted “Text Settings” allow changing font information including colors for text of the given type. |
|
Set Status Polling Interval |
CTRL + I |
Set how much time the GUI will wait to do the next polling for the status tree. |
6.2.3. Status Tree
The status tree presents top level entities that consist of one or more checks for that entity’s health. The top level entity has its status reflect the “worst” status of any element comtributing to that entity.
The nodes of the tree can be expanded to drill into the assorted checks that make up the entity. Those elements may themselves be made of numerous checks, and the same aggregation applies.
Ultimately, each check will report on some information about that entity, and whether that element is in a good state, a neutral state, or a problem state.